A Restaurant Operator's Guide to Financial Benchmarking in the UK (2026)
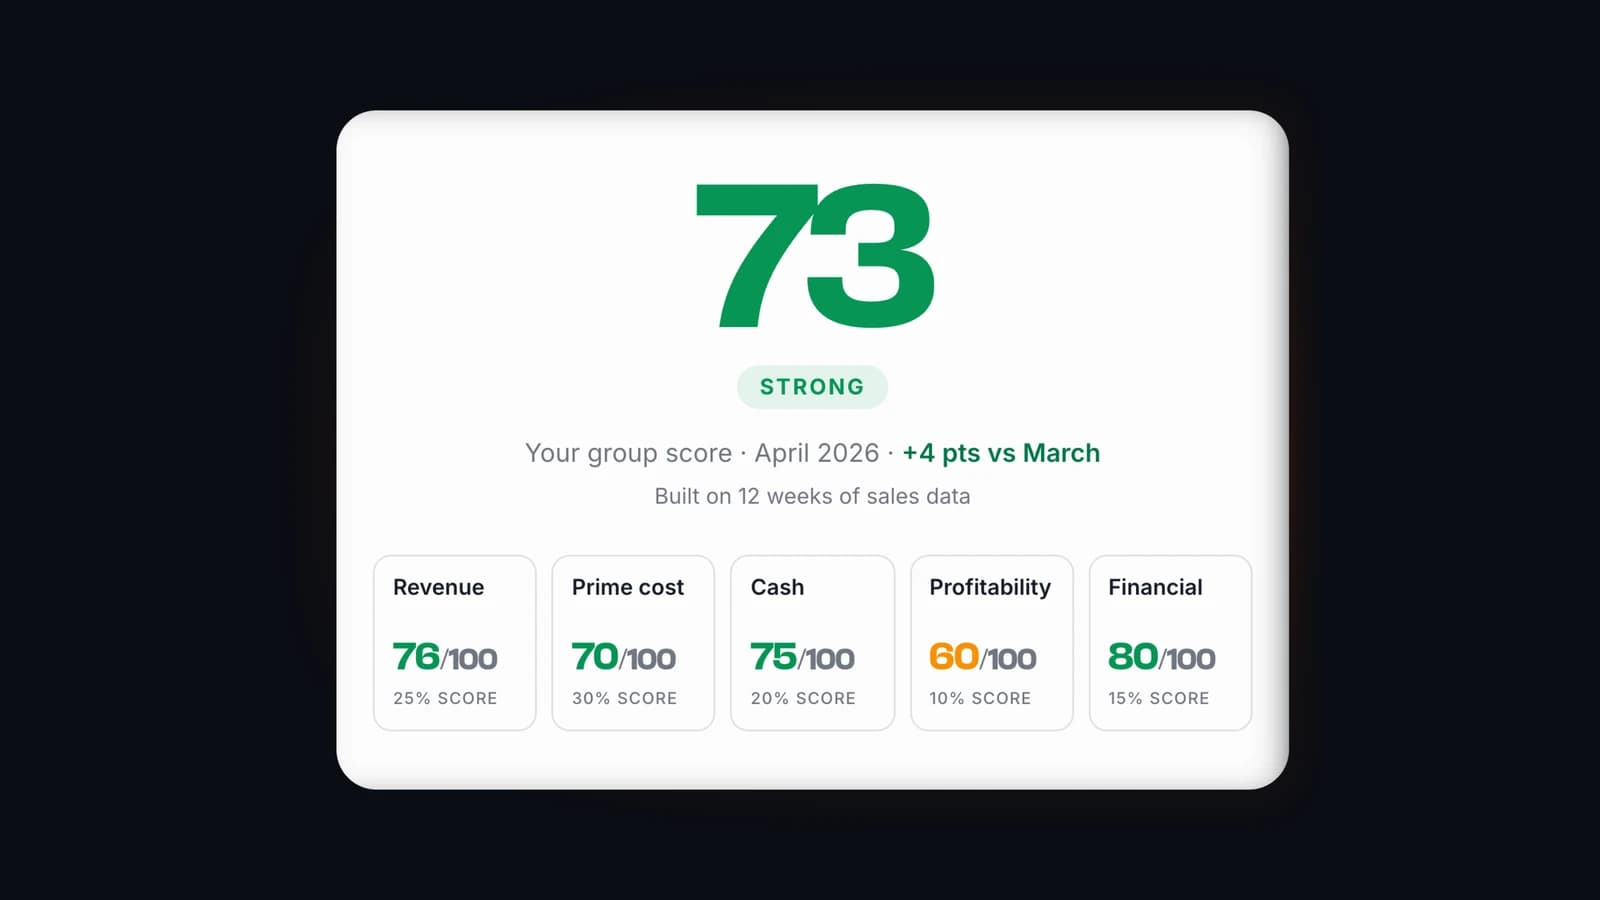
If you run a UK restaurant brand, you have probably asked one of these questions: how do my numbers compare to similar operators? Are my labour costs too high? Why did my bank turn down my expansion loan when my margins look strong?
This guide answers those questions in one place. It covers what benchmarks exist in UK hospitality today, what they miss, and how operators can get a real-time read on their own performance against the sector.
What is a financial benchmark in restaurant finance?
A financial benchmark is a shared reference point that lets you compare your restaurant's performance to similar operators. In practice, this means comparing your numbers, revenue, labour cost ratio, prime cost, and cash conversion, against a defined peer group: same segment, same size band, same region.
Every mature industry has these. Hotels have RevPAR (revenue per available room), published monthly by STR Global and referenced in every hotel loan covenant in the country. Consumer credit has Experian scores. Public equities have Bloomberg data. UK restaurants have, until recently, had nothing equivalent.
The consequence is that operators have been running their businesses without knowing where they actually stand, and lenders, investors, and suppliers have been making decisions about them without a proper frame of reference.
What financial benchmarks exist for UK restaurants today?
There are three sources UK restaurant operators typically reach for. Each has serious limitations.
Companies House filed accounts. Every UK limited company files annual accounts. In theory this is a benchmark; in practice it is a poor one. Accounts are filed up to nine months after year-end, so the "recent" data available at any point is often 12 to 15 months old. Smaller operators file abbreviated accounts that hide most of what matters (labour, COGS, unit economics). By the time a bank reads them, they describe a business that no longer exists.
Industry surveys and trackers. The Propel and AlixPartners Profit Growth Tracker, launched in 2025, ranks the top 25 UK operators by EBITDA growth. It is a strong piece of work, but by design it captures only businesses large enough to file substantive accounts, roughly the top 0.3% of the 100,000-plus UK hospitality operators. Everyone else is invisible to it.
Sector reports from consultancies. Firms like CGA, Deloitte, and PwC publish periodic hospitality sector reports with headline averages. Useful for context, but averages are national and lag by months to a year. They tell you what the sector did, not what similar operators to you are doing right now.
The pattern is consistent: UK restaurants have plenty of historical, aggregate, top-of-market data. None of it lets a founder running a two-site brand in Manchester compare themselves in real time to peers.
Why UK banks reject restaurant loans (even when the numbers look strong)
Restaurant founders often ask why they were turned down for a loan when their numbers look healthy to them. The reason is usually not that the numbers are weak, it is that the bank has no reliable way to know they are strong.
Bank credit teams evaluate hospitality loans using three inputs, in this order:
- Filed accounts (nine months old, static, often incomplete for smaller operators).
- Card receipts (a partial read of revenue with no visibility into labour discipline, prime cost control, or cash cycle).
- Bank statement analysis (a spot-check of cash flows over recent months).
None of these tell the credit officer whether the applicant is in the top quartile of comparable operators or the bottom. In the absence of a peer benchmark, the credit officer is forced to apply blanket assumptions to the entire sector, which means the disciplined operator gets rejected alongside the disorganised one.
This is not a bank problem in isolation. It is a data problem in the ecosystem. Fix the data and the credit decisions improve.
The financial metrics that actually matter for restaurant benchmarking
If you want to benchmark your restaurant properly against peers, the metrics that carry the most signal are the ones that describe operating discipline, not just top-line revenue. In our experience reading live financial data across the UK restaurant sector, the most predictive are:
Prime cost ratio: food cost plus labour cost as a percentage of revenue. The single best summary of operating discipline. The sector-typical range is 55 to 65%. Operators below 55% are running exceptional discipline; operators above 65% are usually in trouble.
Working capital cycle: days between paying suppliers and receiving revenue. Well-run restaurants run negative working capital (customers pay before suppliers do), typically 5 to 15 days. Cycles above 30 days usually signal trouble.
COGS variance: how much the cost of goods moves week over week as a percentage of sales. Below 2 percentage points of variance signals strong purchasing discipline. Above 5 signals loose control.
Cash resilience: months of operating expenses currently held in cash. The sector-typical range is 1 to 3 months; anything below 1 month is fragile.
Almost none of these show up in filed accounts. All of them are readable from live bank, POS, and invoice data.
How to benchmark your restaurant in real time
Until recently, the only way to benchmark your restaurant properly was to hire a consultancy, pay for a sector report, or piece it together yourself from partial data. All three are slow, expensive, or unreliable.
Real-time benchmarking is now possible because three things have changed. Open banking (introduced in the UK in 2018) lets operators share bank data securely and instantly with third-party platforms. POS systems now expose transactional data through APIs. AI can normalise the messy invoice data that used to require manual reconciliation.
The result is that the raw material for a real-time restaurant benchmark now exists. Operators can connect their bank, POS, and invoice systems in under 10 minutes and see how they compare to the sector within days.
This is what the Alpa Score does. It reads your live financial data, computes the metrics that matter (prime cost, labour ratio, working capital cycle, COGS variance, cash resilience), and produces a single benchmark score refreshed monthly. The score compares you to peers in your segment and size band, so you are being read against operators actually similar to yours.
The Alpa Score is free to try for 30 days, then £29 per site per month.
What the future of restaurant financial benchmarking looks like
The UK hospitality sector is roughly where hotels were in the mid-1980s, before STR built the RevPAR benchmark that now underpins the entire hotel industry. STR took a decade to become the sector standard, and another decade before lenders required its data in loan covenants.
The conditions for a restaurant equivalent are meaningfully better than they were for hotels forty years ago. Open banking, live POS data, and machine-normalised invoicing mean the same benchmark can be built in two to three years rather than twenty. The bottleneck is not technology; it is whether the market commits to a public benchmark that lenders, investors, and operators can all reference.
The Alpa Score Index, a monthly public reading of UK restaurant performance published in partnership with Propel Hospitality, is the first serious attempt at that public benchmark. The inaugural reading publishes at the end of August 2026, with monthly readings from there.
Frequently asked questions
- How do I benchmark my restaurant's financial performance in the UK?
- Real-time benchmarking is now possible through platforms that read your live bank, POS, and invoice data and compare you to similar operators in your segment and size band.
- Why do UK banks reject restaurant loans even when the numbers look good?
- Banks rely on filed accounts (nine months old), card receipts (revenue only), and bank statement analysis. Without a peer benchmark, they can't distinguish top-quartile operators from bottom-quartile ones, so they apply blanket assumptions across the sector.
- Is there a UK equivalent of RevPAR for restaurants?
- Not until now. The Alpa Score Index, publishing monthly from the end of August 2026 in partnership with Propel Hospitality, is the first published financial benchmark for UK restaurant brands.
- How much does it cost to benchmark a restaurant with Alpa?
- The Alpa Score is free for the first 30 days, then £29 per site per month. Setup takes under 10 minutes.