Know your score. Grow faster.
One score. Five pillars. Updated monthly. Built from your POS sales and bank data, the same sources that also power your weekly P&L. The number tells you where your restaurant stands; the platform gives you the levers to move it.
A score is never just a score.
Your Alpa Score isn't decorative. It's how you grow, as a trajectory check, a negotiating tool, and a credential that opens doors.
Prove the work is paying off.
See where you're improving and where you're slipping. Prove the work is paying off, instead of guessing.
Walk in with evidence.
Show your score to your wholesaler when you ask for longer payment terms. Hand it to your landlord at rent review. The conversation shifts from "do I trust you" to "how do we work better together".
Faster lender conversations.
Banks, lenders, franchisors and partners can see your numbers in minutes: a real-time financial track record they trust. No more handing over three years of statements and waiting for someone's gut feel. It's one input they weigh alongside their own checks, not a replacement for them.
Five pillars. One number. One clear answer.
Each pillar covers a different angle of financial health. Together they answer the only question that matters: is your restaurant getting stronger?
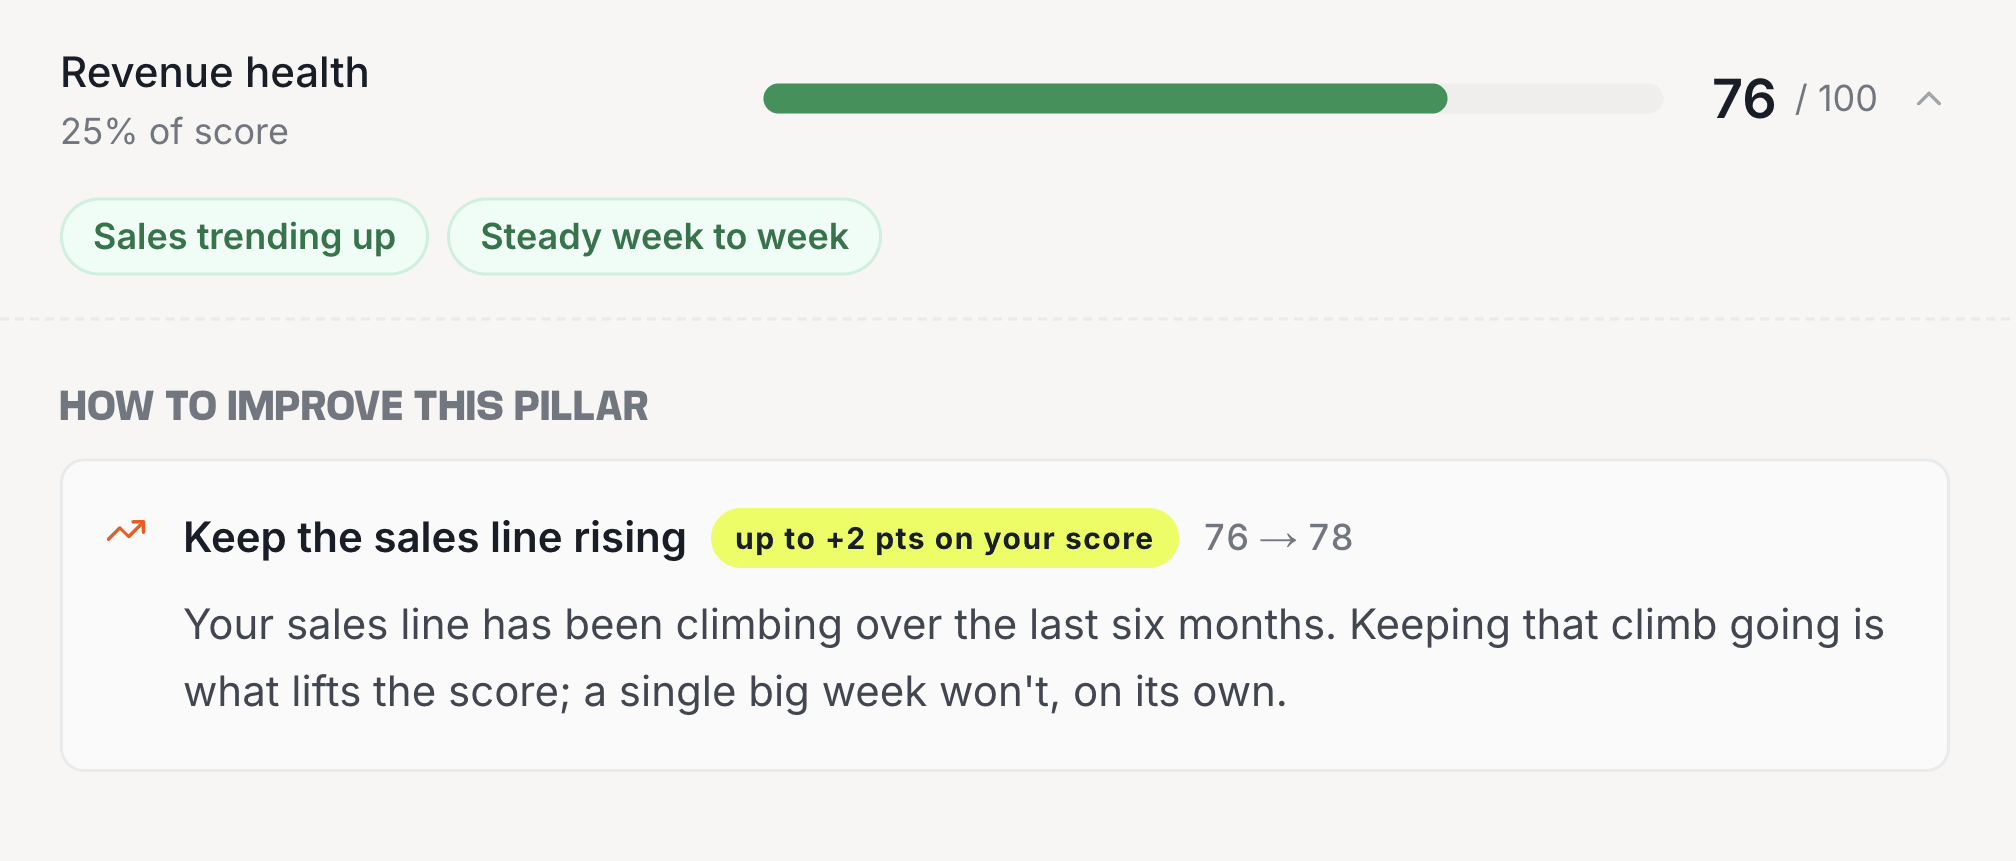
Revenue health
Weekly sales trend and how steady they are, in context.
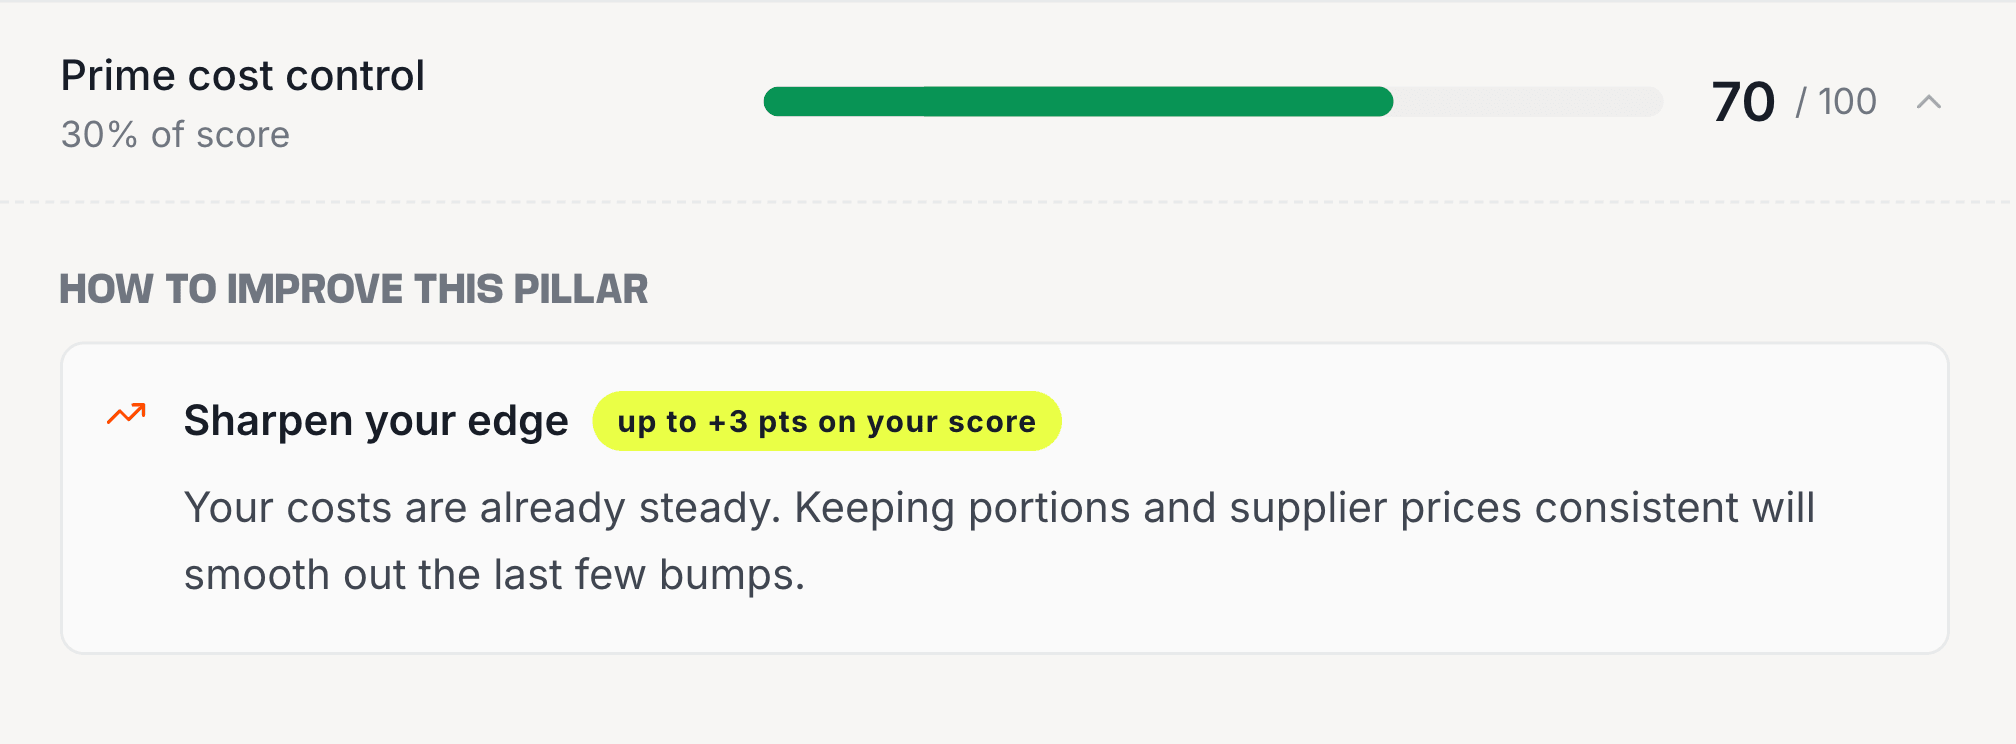
Prime cost control
Food cost, staff cost, gross margin stability. Operational tightness.
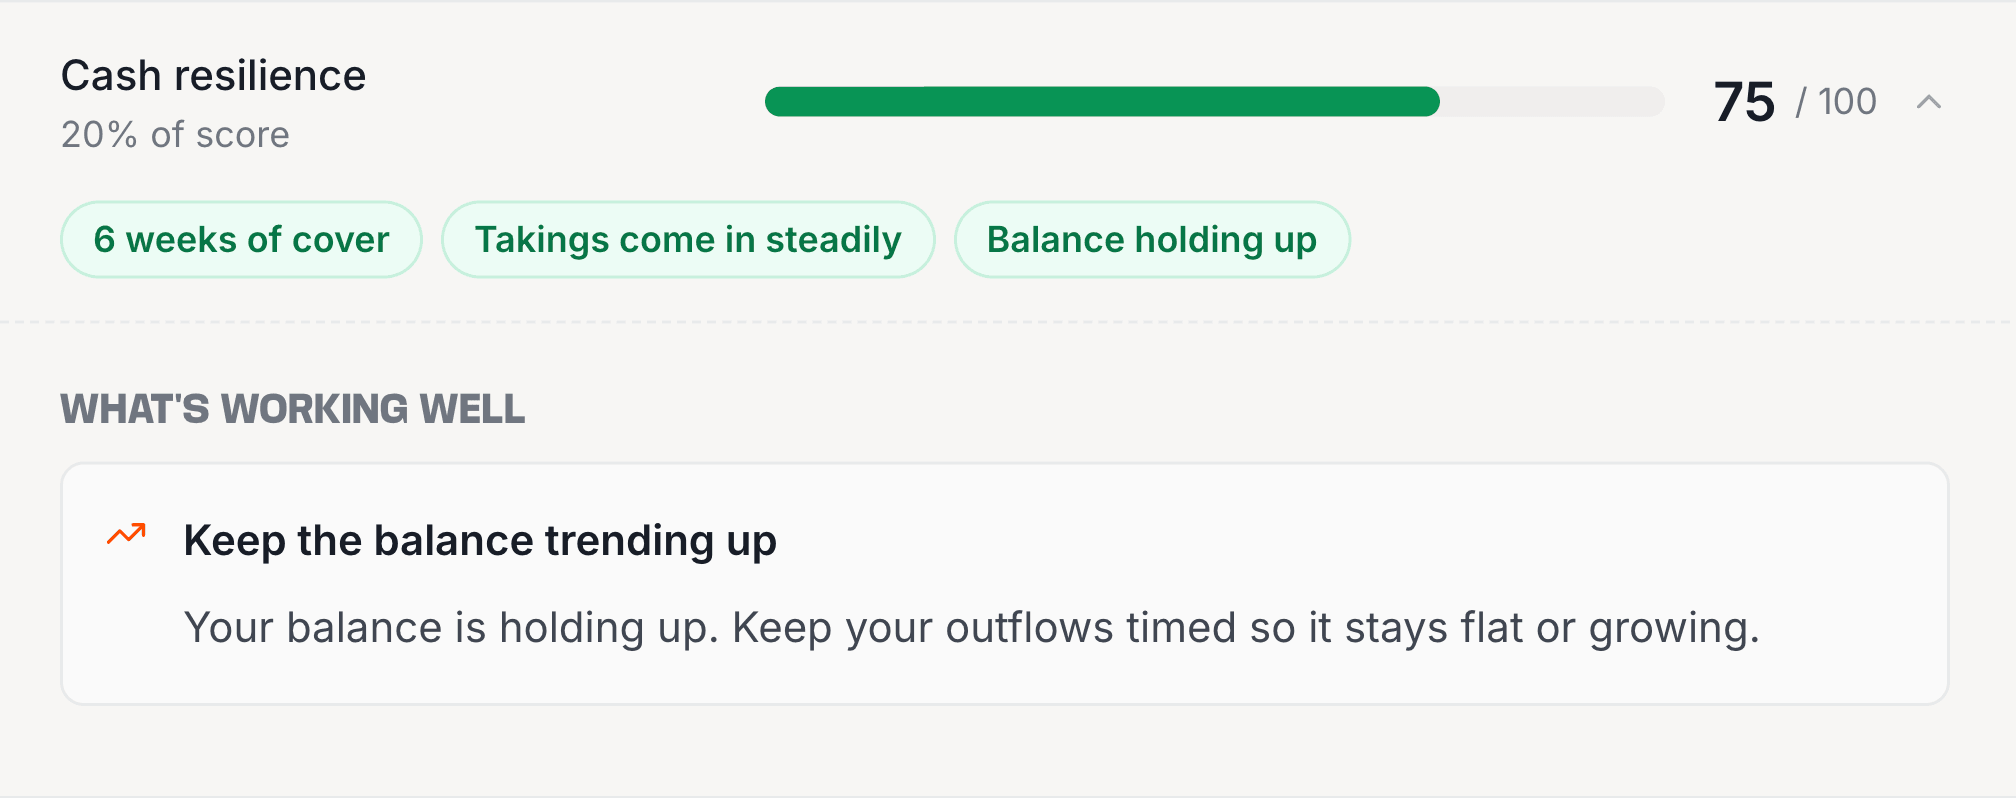
Cash resilience
Runway, cash trajectory, coverage against a slow week.
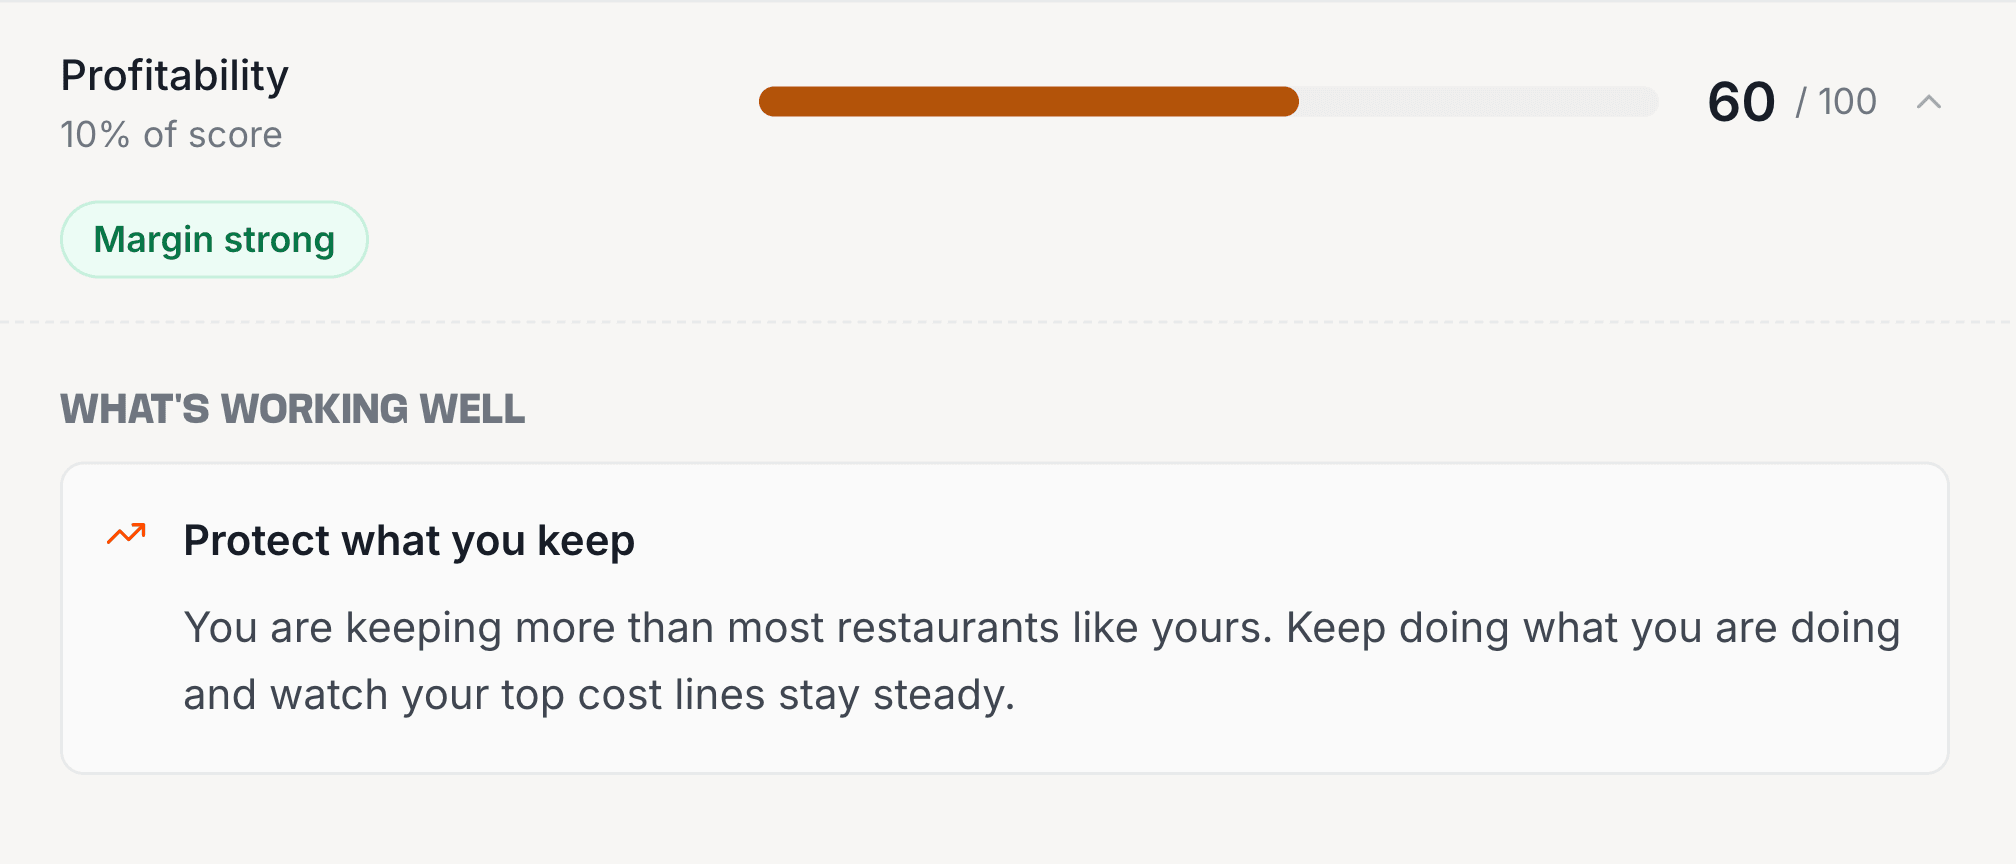
Profitability
Operating profit margin vs your concept's benchmark.
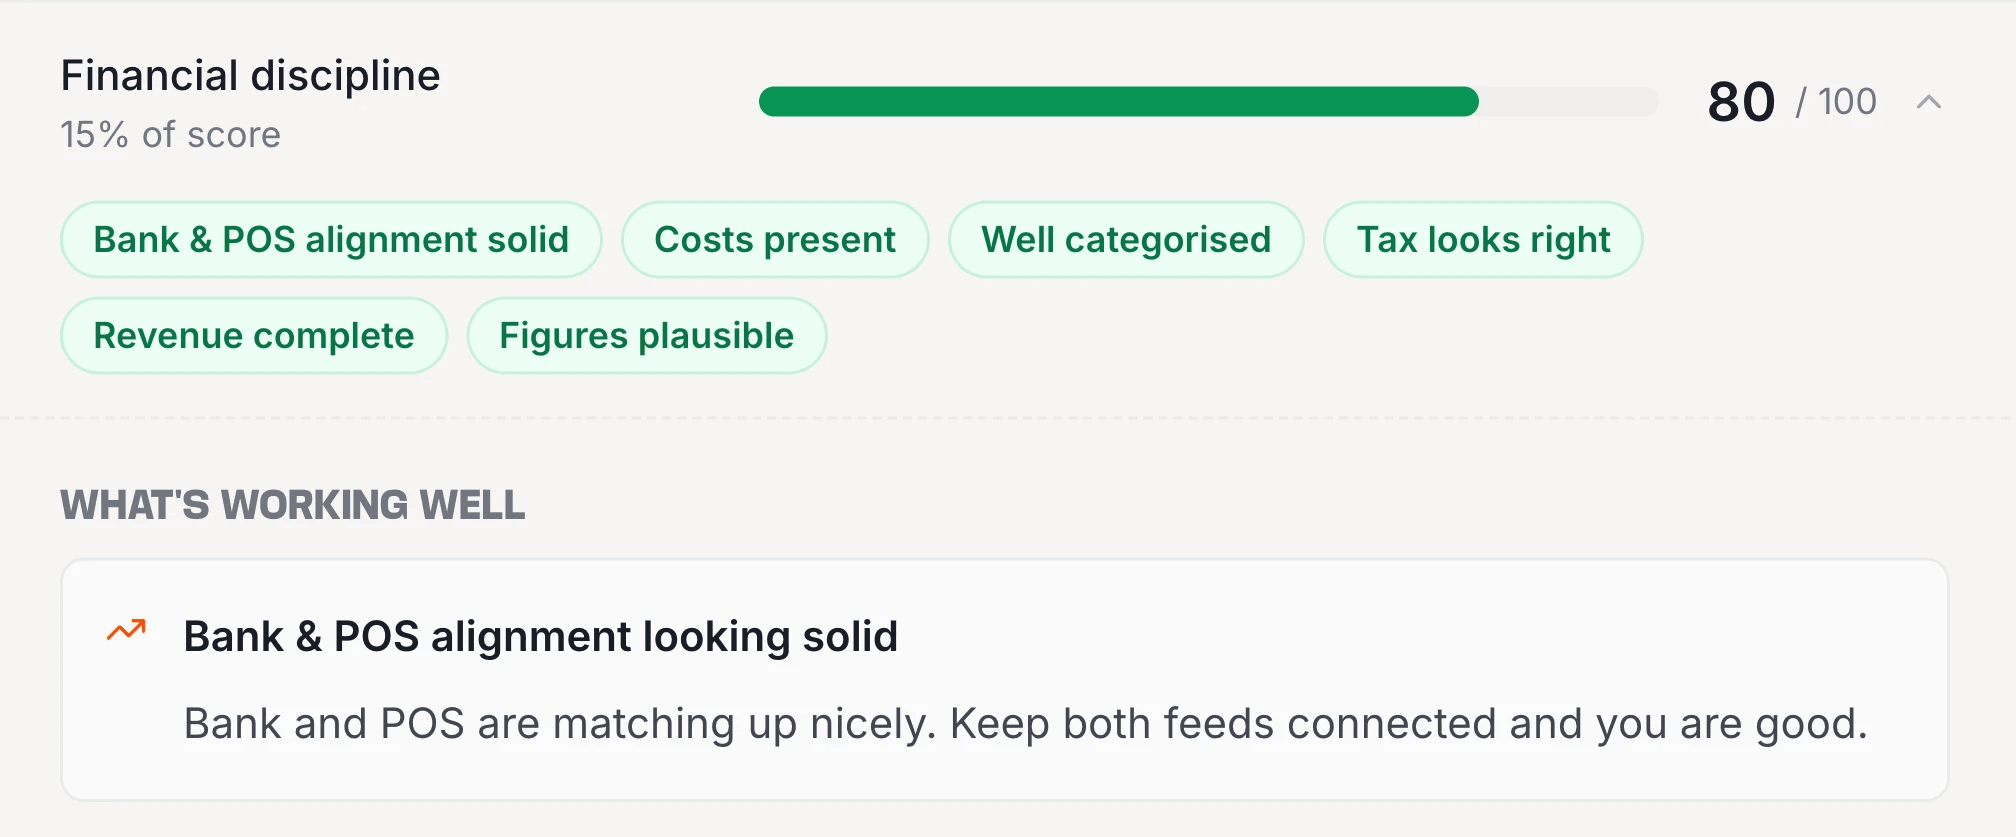
Financial discipline
Sales, costs and cash, tying up.
Transparent. Auditable. Yours.
No black box. The score is built from your POS sales and bank data, the same sources that also power your weekly P&L. Trace every pillar back to the numbers it came from.
- Each pillar is scored out of 100.
Revenue health, prime cost control, and the rest each get their own score out of 100, measured against the benchmark for your concept. Every score is built from the trading data you've connected. If you've only just opened, your scores play it safe at first, then firm up as your trading history builds.
- Combined into one monthly score.
Some pillars count more than others. Prime cost control, the biggest at 30%, moves your score most; profitability, the smallest at 10%, moves it least. The result is one number out of 100, refreshed at the start of every month.
- Every component traceable.
Tap any pillar to see the underlying P&L lines, the comparison period, and the specific levers that would move it. No surprises.
- Monthly score, weekly recommendations.
The score itself moves monthly. Between updates, your Monday briefing flags which pillar is most likely to shift, and what action would shift it. Fix what it flags and your score updates straight away.
Every pillar has a lever. Alpa puts the lever in your hand.
The score is the readout. The platform is the engine. Here's what each pillar measures, and the features in Alpa that help you move it.
Revenue health.
Strong revenue isn't a single big week. It's a line that holds up against last month, last quarter, last year, through the seasons.
- What we measure. Whether your weekly sales are growing, and how steady they hold week to week.
- How Alpa helps. Live weekly sales by location, channel and day of week. Compare any period; spot the slip before it becomes a slide.
- Lever to pull. Reconcile delivery commissions properly so revenue isn't understated. Use Today's view to act on the same-day-last-week comparison.
Prime cost control.
The biggest pillar. Where most operators win or lose, and where most don't have a tight grip on what's actually happening week to week.
- What we measure. Food cost and staff cost as a share of sales, and how steady they hold from month to month.
- How Alpa helps. Food cost sourced from invoices and bank with a confidence flag on every line. Staff cost from your bank. Spot which supplier moved the line.
- Lever to pull. Renegotiate the supplier whose price-per-kilo crept up. Adjust staffing on the days when it doesn't pay back.
Cash resilience.
Profit is opinion; cash is fact. The pillar that landlords, lenders, and franchisors care about most, because a profitable restaurant with no cash is one bad week from trouble.
- What we measure. Steady weekly income, healthy balance trend, and cover for a slow week.
- How Alpa helps. Bank-first cash flow report - operating, investing, financing - with opening and closing balance per week. Works the moment you connect your bank.
- Lever to pull. Tighten the days between sale and payout (delivery platforms). Push out the days between supplier delivery and supplier payment.
Profitability.
All the discipline in the world matters less if your operating profit margin is below your concept. This pillar puts your number against your peers: QSR vs QSR, casual vs casual, fine dining vs fine dining.
- What we measure. How your operating profit compares to other restaurants in your concept, from QSR to casual dining.
- How Alpa helps. Profit margin per location and group level on every weekly P&L. You pick your concept at sign-up: QSR, casual, fine dining, virtual brand. Alpa benchmarks against the right peers automatically.
- Lever to pull. The pillars above feed this one. Move prime cost or revenue, and profitability follows. Move neither, and the line shows it.
Financial discipline.
Tightly run businesses categorise their spend and don't leave gaps in their Profit and Loss. The pillar that proves you run a tight ship.
- What we measure. Whether your sales, costs and cash all tie up cleanly.
- How Alpa helps. Auto-categorisation handles the bulk. Anything left surfaces as a tap-to-classify line in your P&L. Missing-invoice nudges in the Monday briefing.
- Lever to pull. Resolve the unclassified transactions before Monday. Forward delivery statements when they arrive instead of letting them stack.
Same number. Different focus. From owner to restaurant manager.
Whether you own the group, run operations, or look after a single location, the score lands in the right shape for the decisions you make.
Every location + cash position
- Score for every location
- Cash flow across all your locations
- Weekly company profitability summary
- Profit margin and trend per location
Multi-site P&L + costs
- Every location's P&L, side by side
- Staff cost % per location
- Profit margin across all your locations
- Weekly company profitability summary
My location + today's tasks
- My location score, pillar by pillar
- Today's sales vs same day last week
- Unclassified spend (tap to categorise)
- Weekly P&L summary for my location
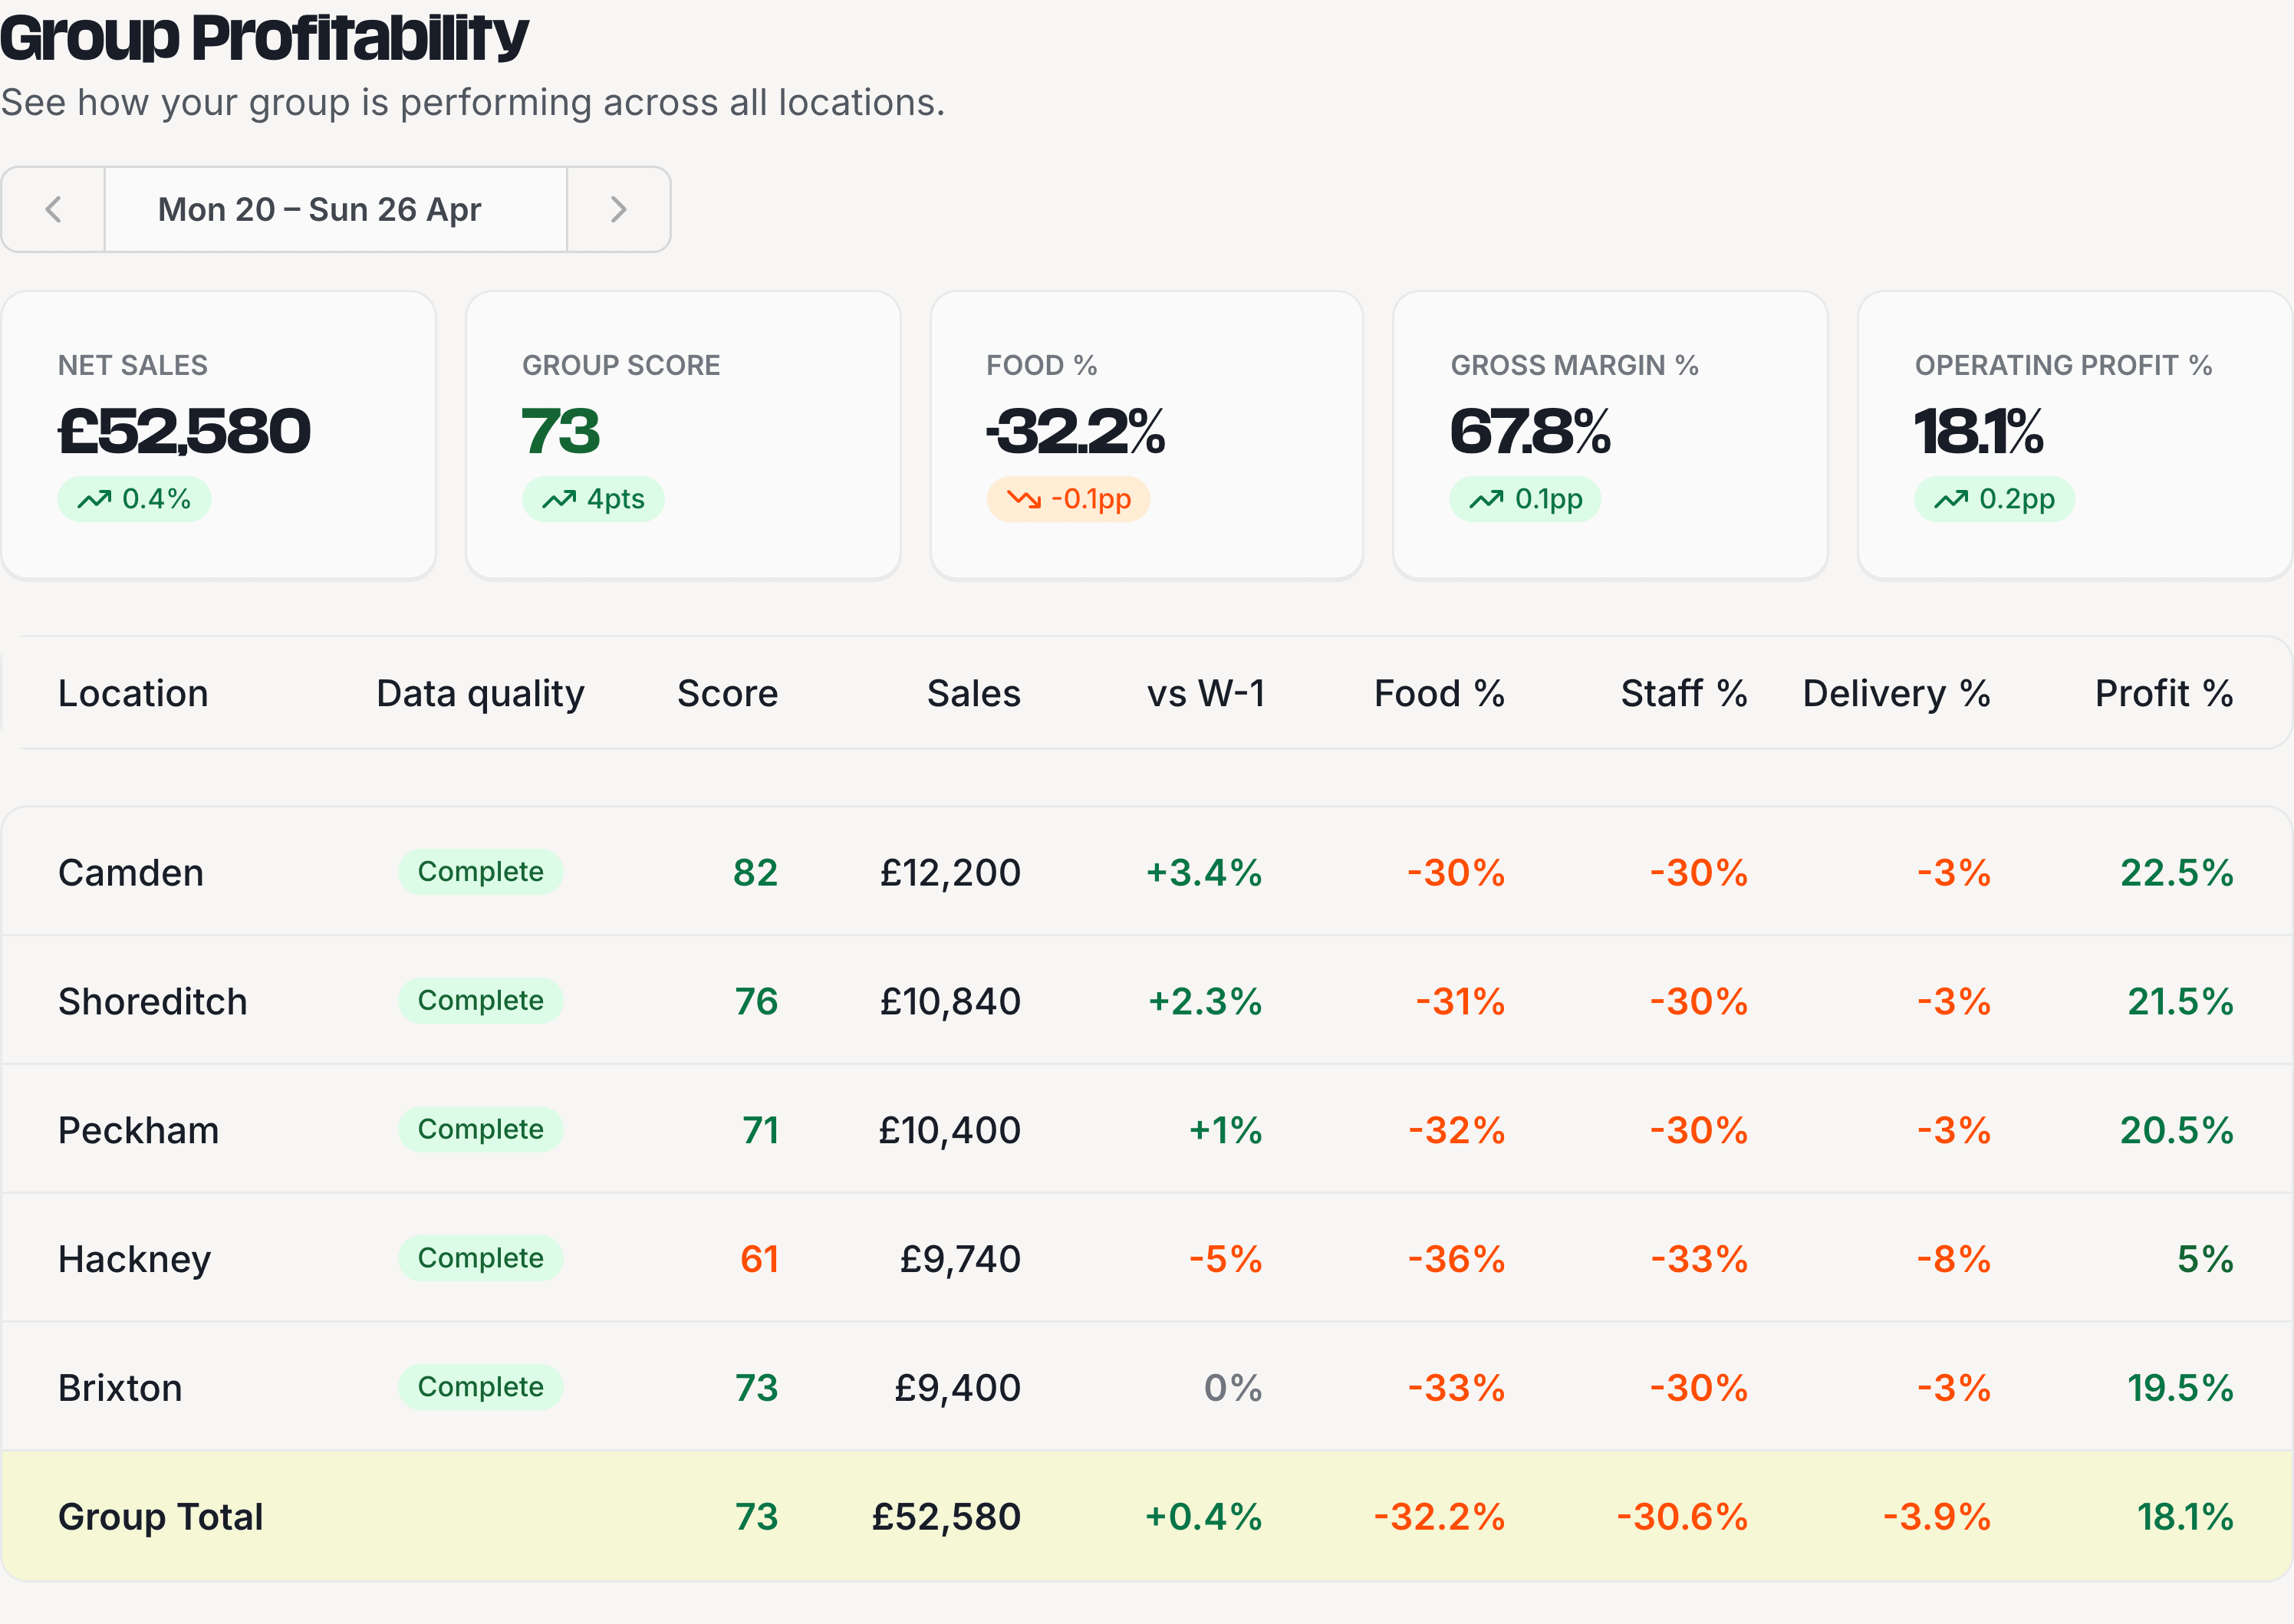
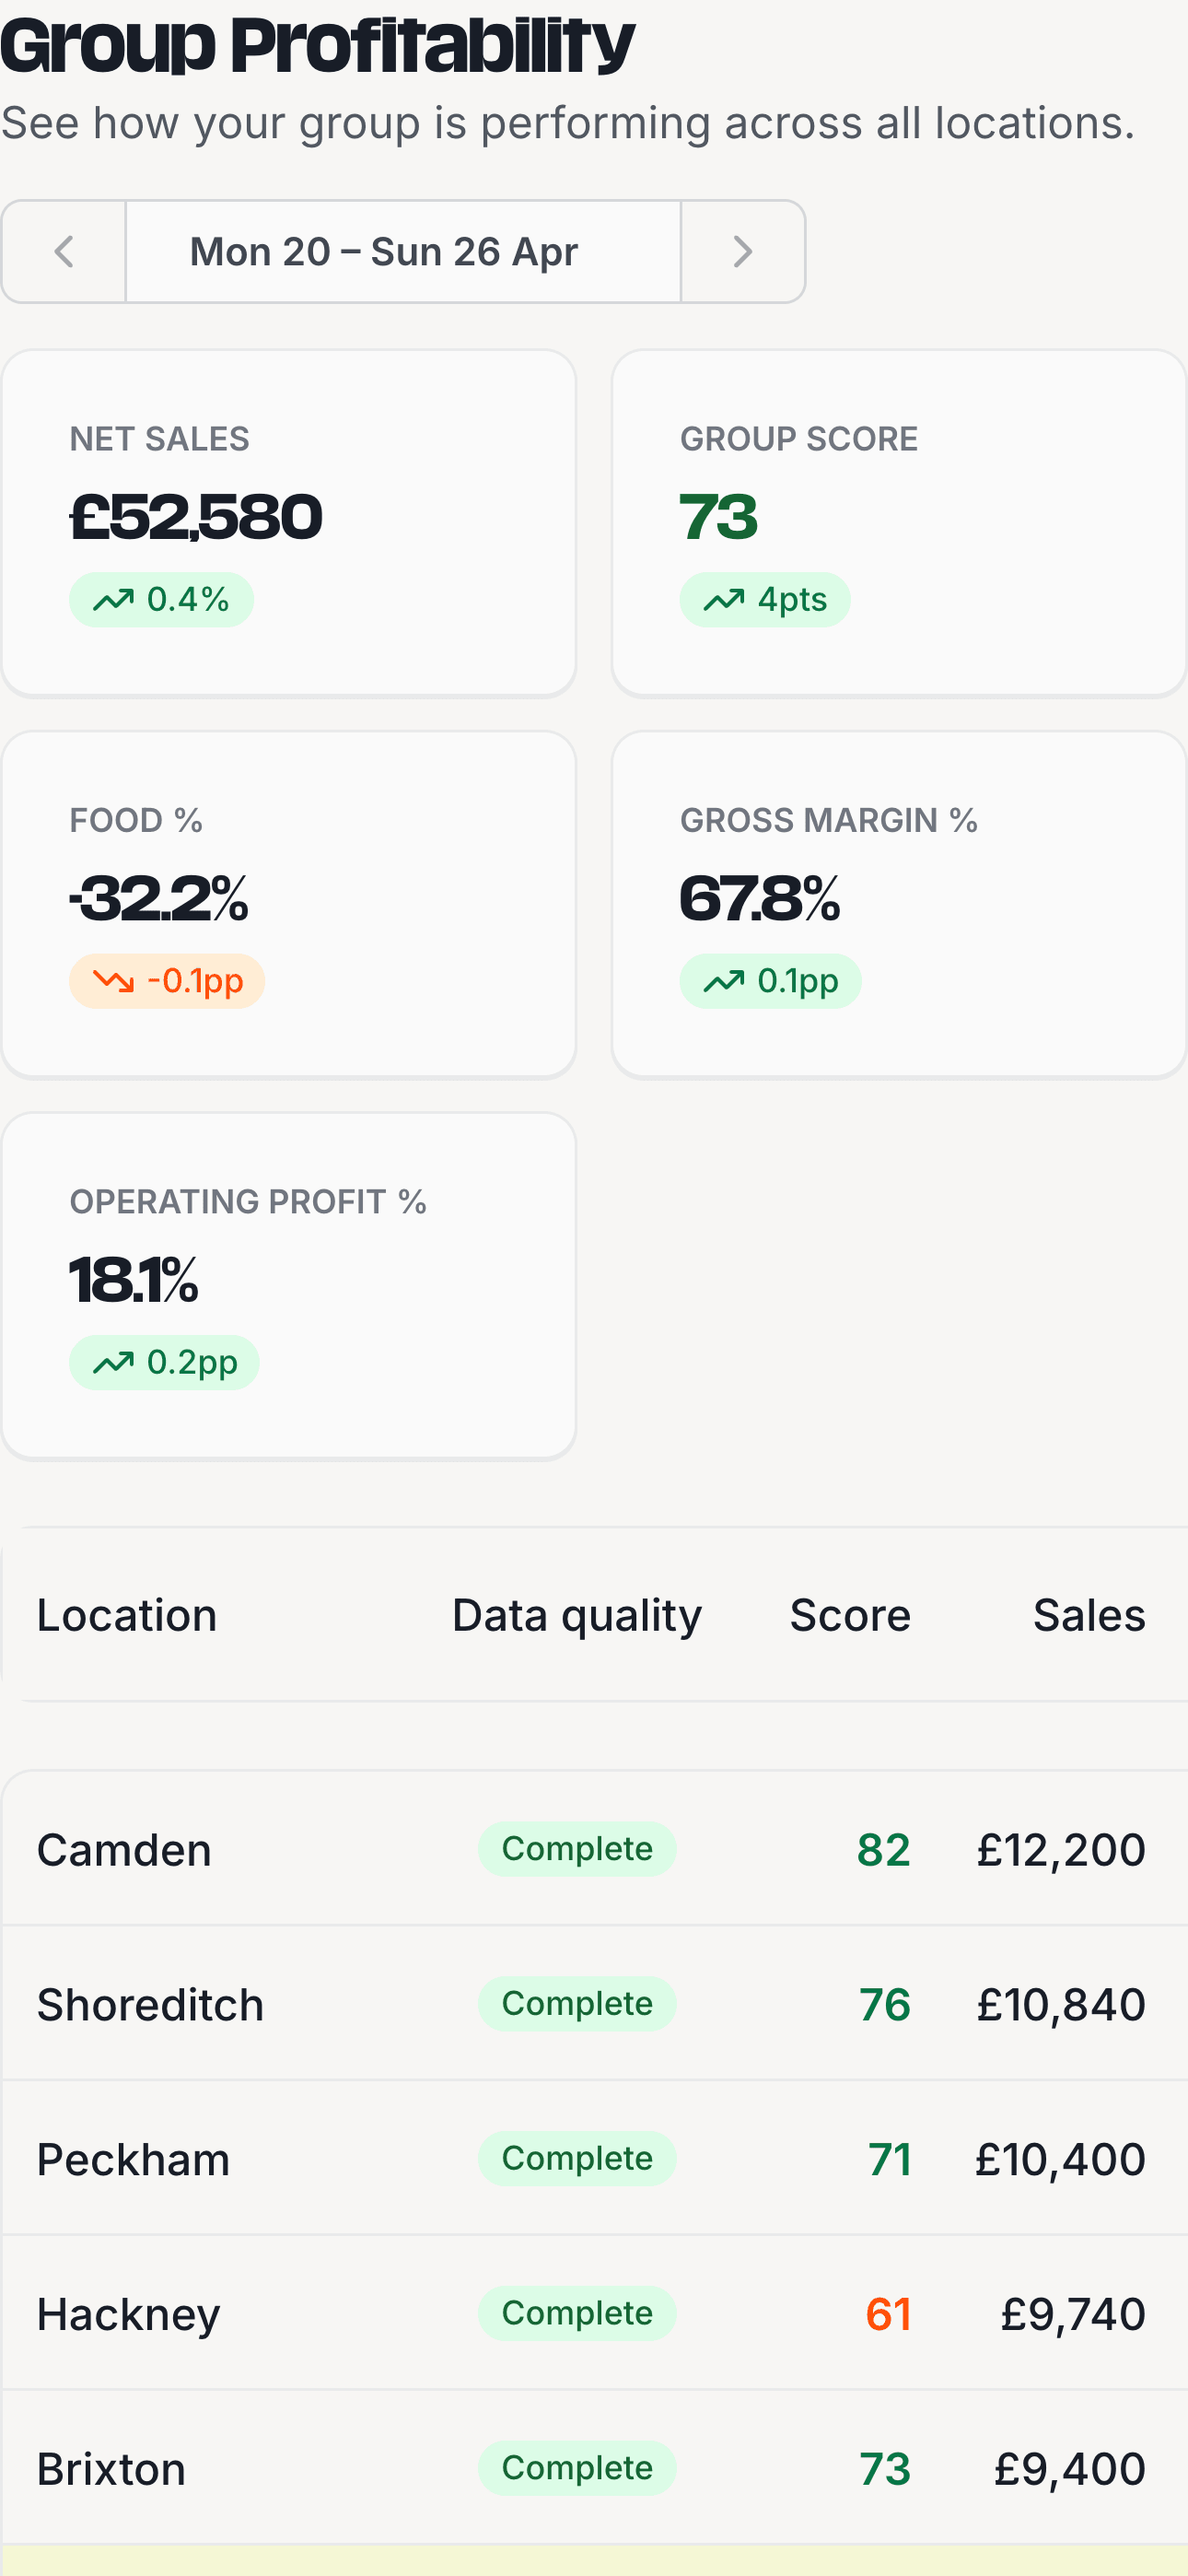
Every location. Every score. One view.
See every location's score, profit margin, and trend on one screen. Green for on-track, amber for drifting, red for needs attention. The location that's slipping jumps out before anyone has to ask.
Connect in 10 minutes. Know your numbers by tonight.
Connect your bank and till in under 10 minutes. Your live numbers land the same day, your first Monday briefing within the week. 30 days free. No credit card required.