Your group score. Location by location.
One Alpa Score for the group. One per location. The location that's dragging the average is the first thing you see, every Monday morning.
Multi-site Insights is included in your £29 per-location price. 30 days free.
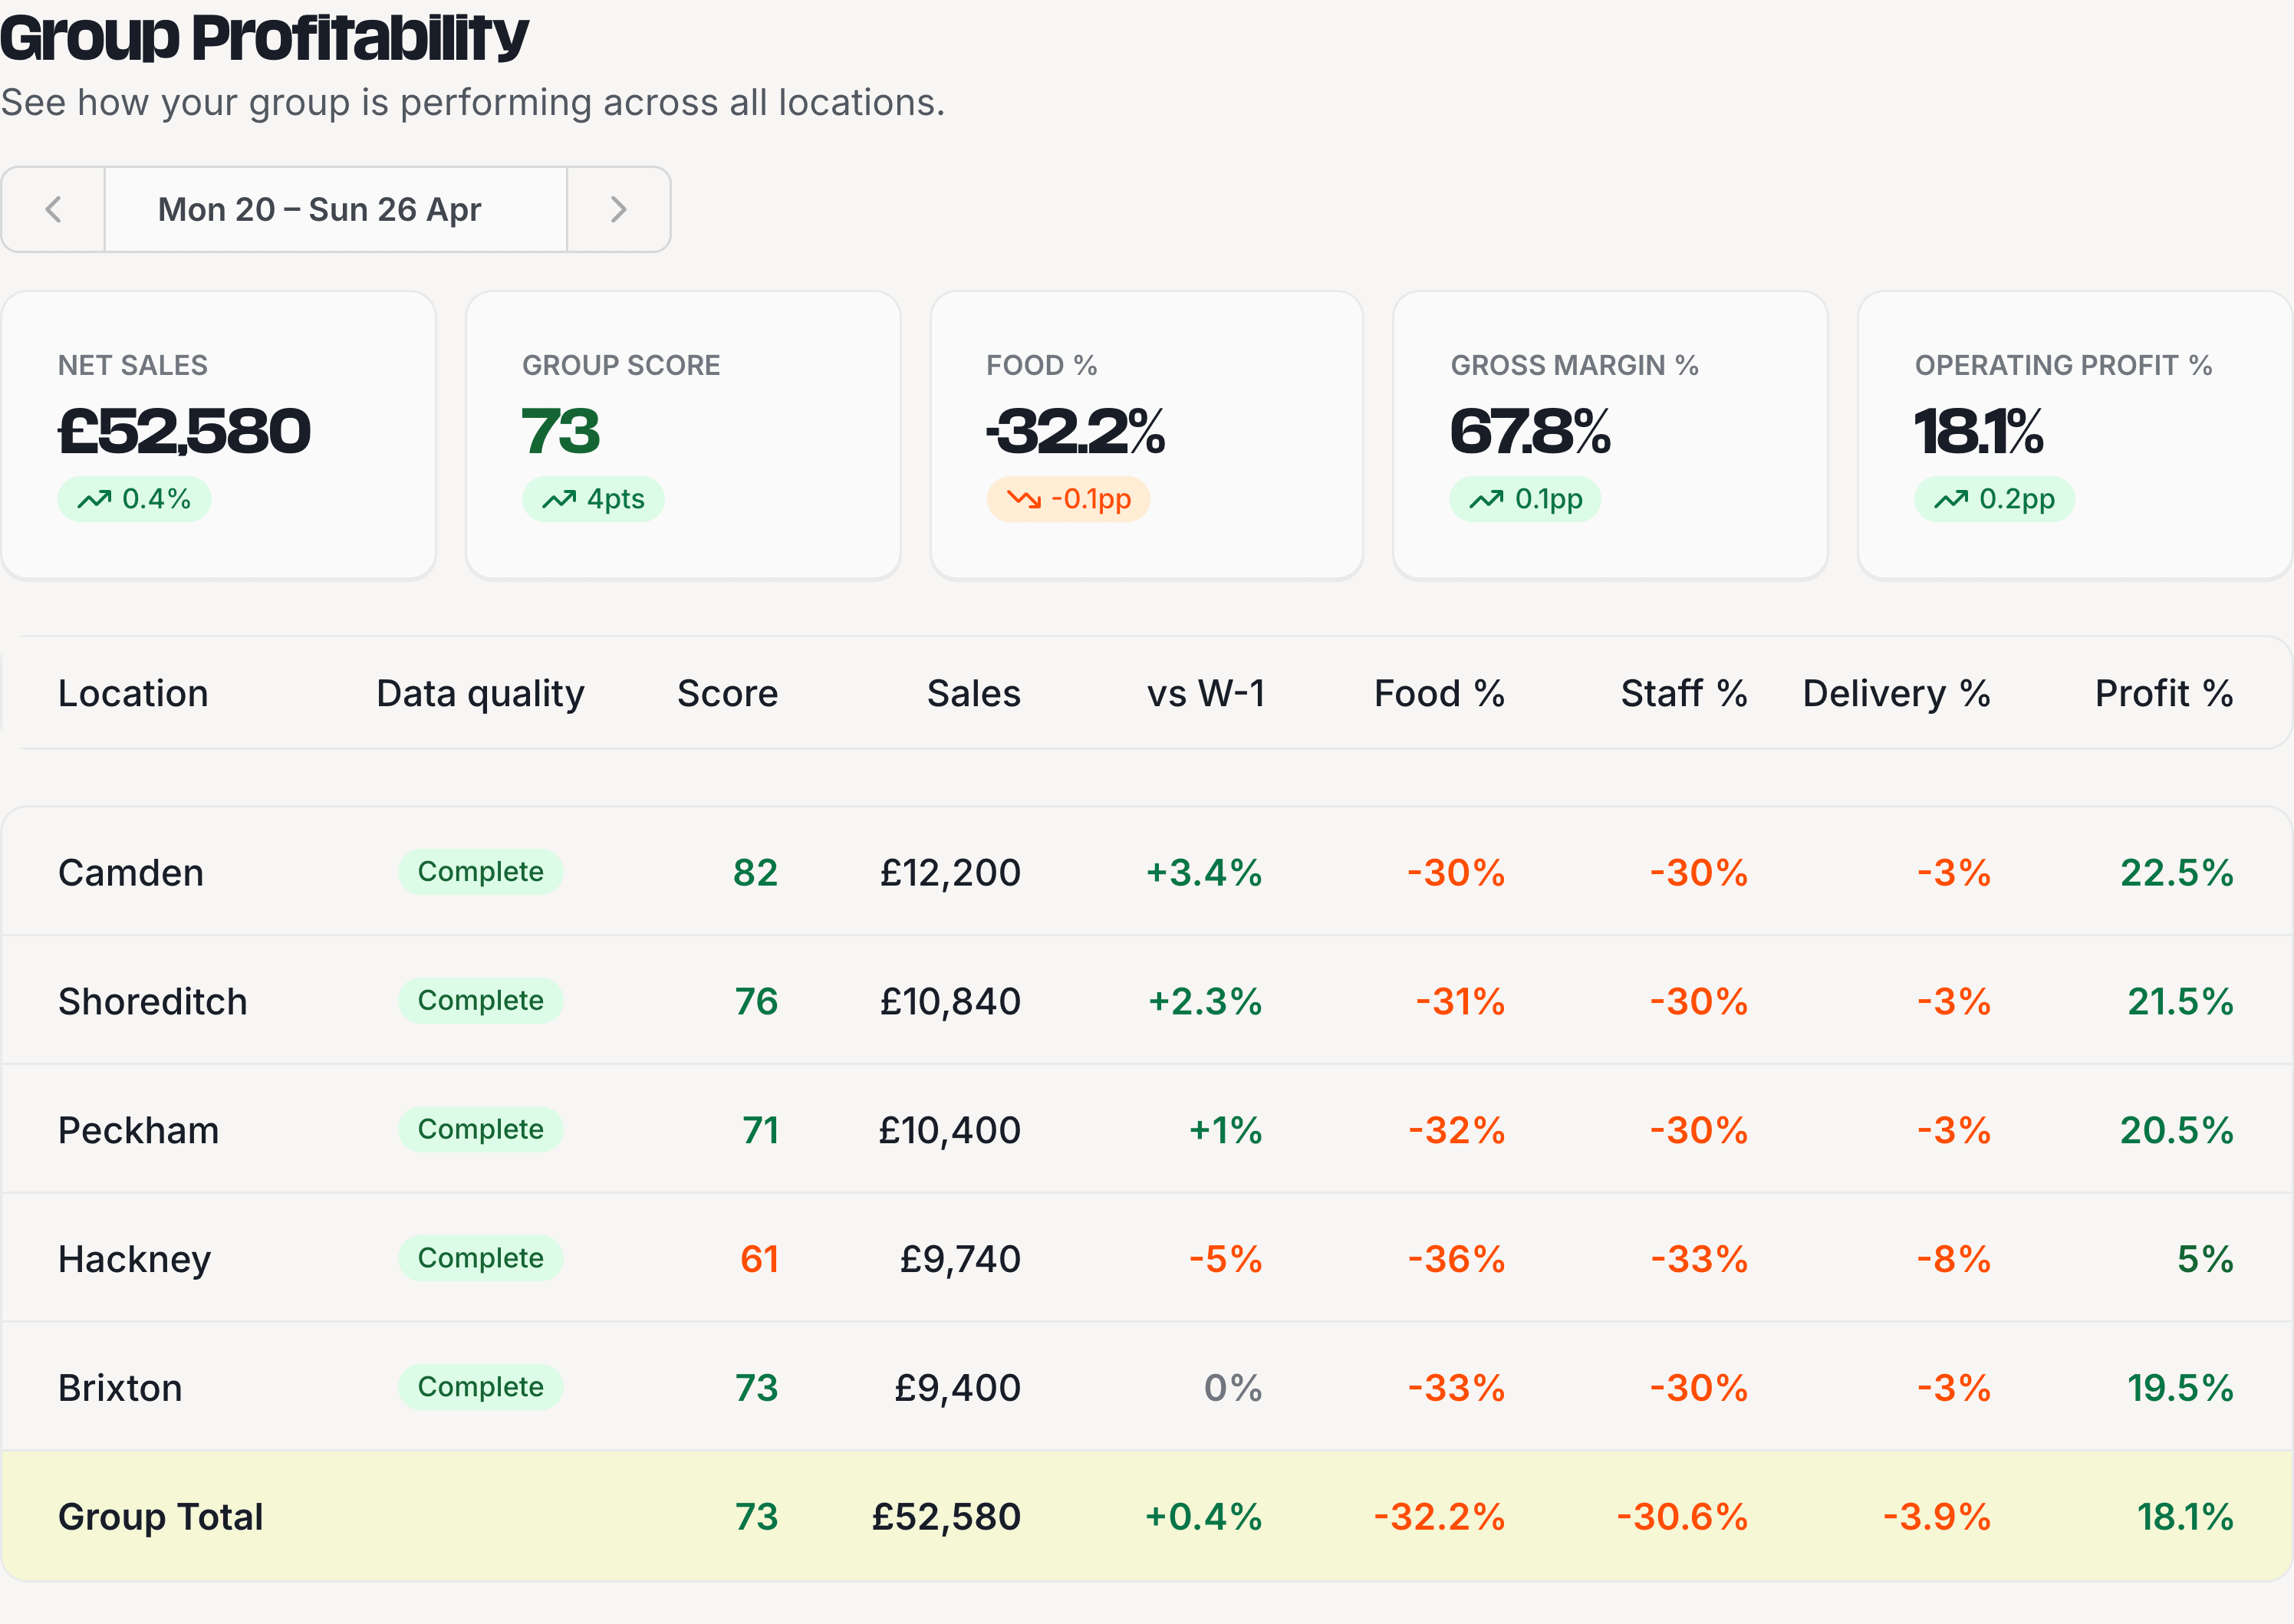
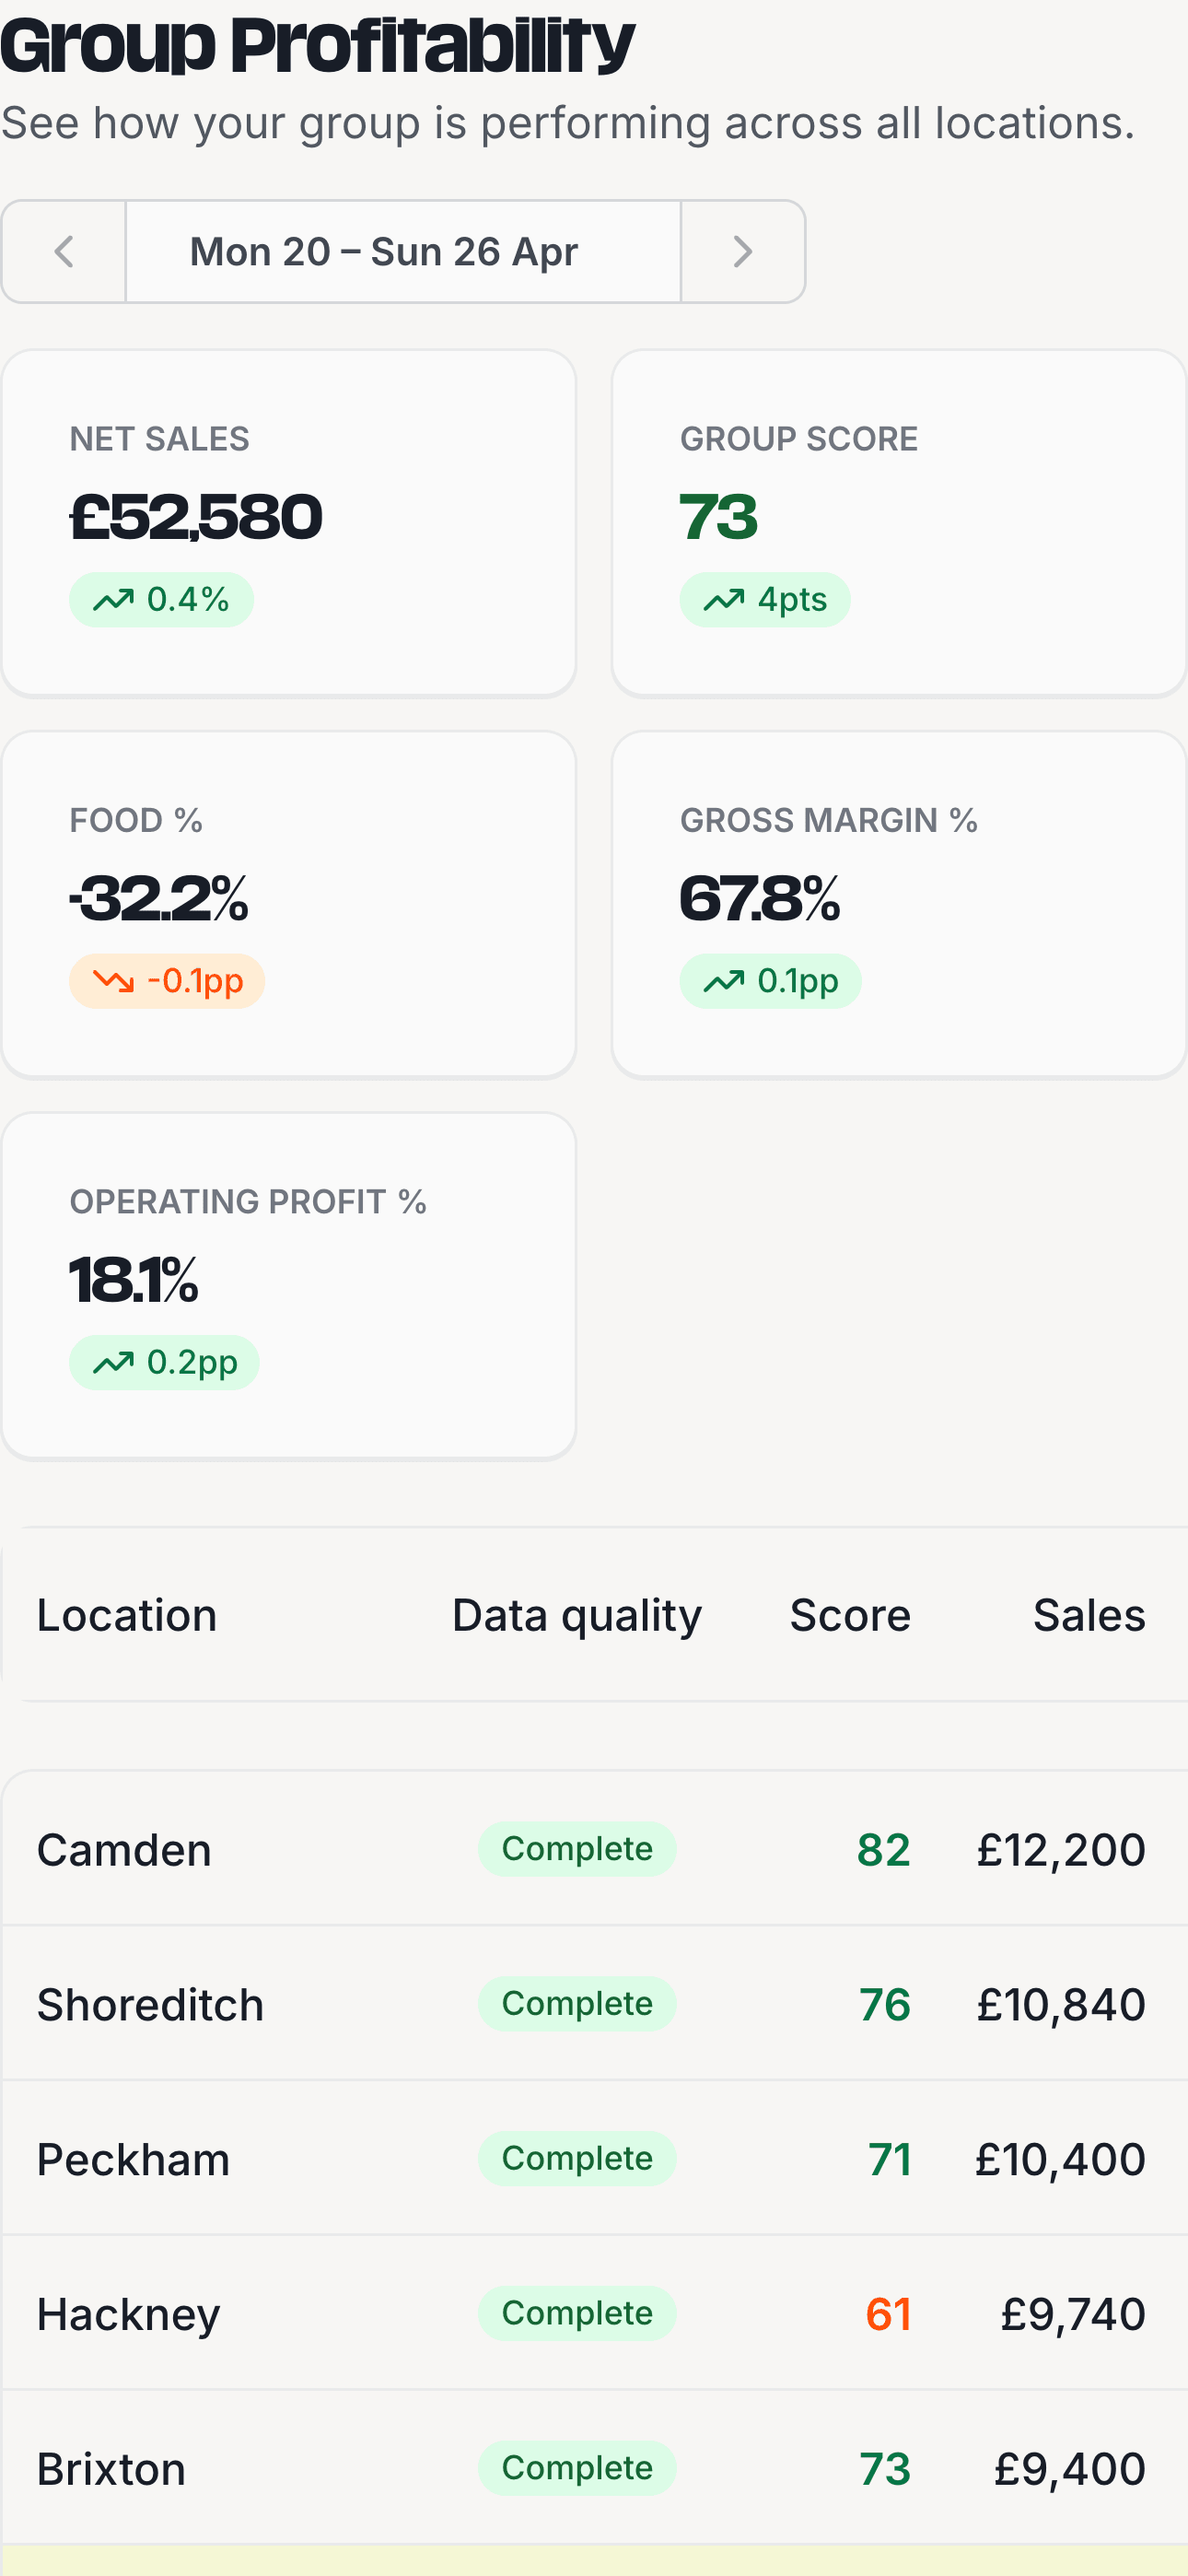
This week at Your Group
Changes vs. previous weekFour of five sites are trending up; Hackney is the outlier: 32% food cost, margin down 7 points, and the only site where your effective delivery commission tops 30%.
Effective commission hit 31.4% this month, up 1.2 points, against the 25-30% most independents pay. Worth a rate check or a price pass on your delivery menu.
The three questions multi-site operators ask first.
Locations ranked by Alpa Score and profit margin. The outlier sits at the bottom of the table. Open it and the briefing tells you which pillar moved.
Group-level supplier visibility. See total spend with each vendor across every location. Pinpoints which supplier moved and at which location.
Group-level Monday briefing leads with the location or pillar that moved most. Specific, actionable, every Monday morning.
Spot the trends. Spot the outliers. Watch every location grow.
Every location on one screen: score, margin, trend. The location that's slipping jumps out. The location that's hitting its stride does too. You take action where it matters, then watch the numbers move.
- Group score + per-location score. One number for the group, one per location.
- Score history per location. See direction, not just position.
- Sort and rank. By score, by profit, by trend. The outlier surfaces itself.
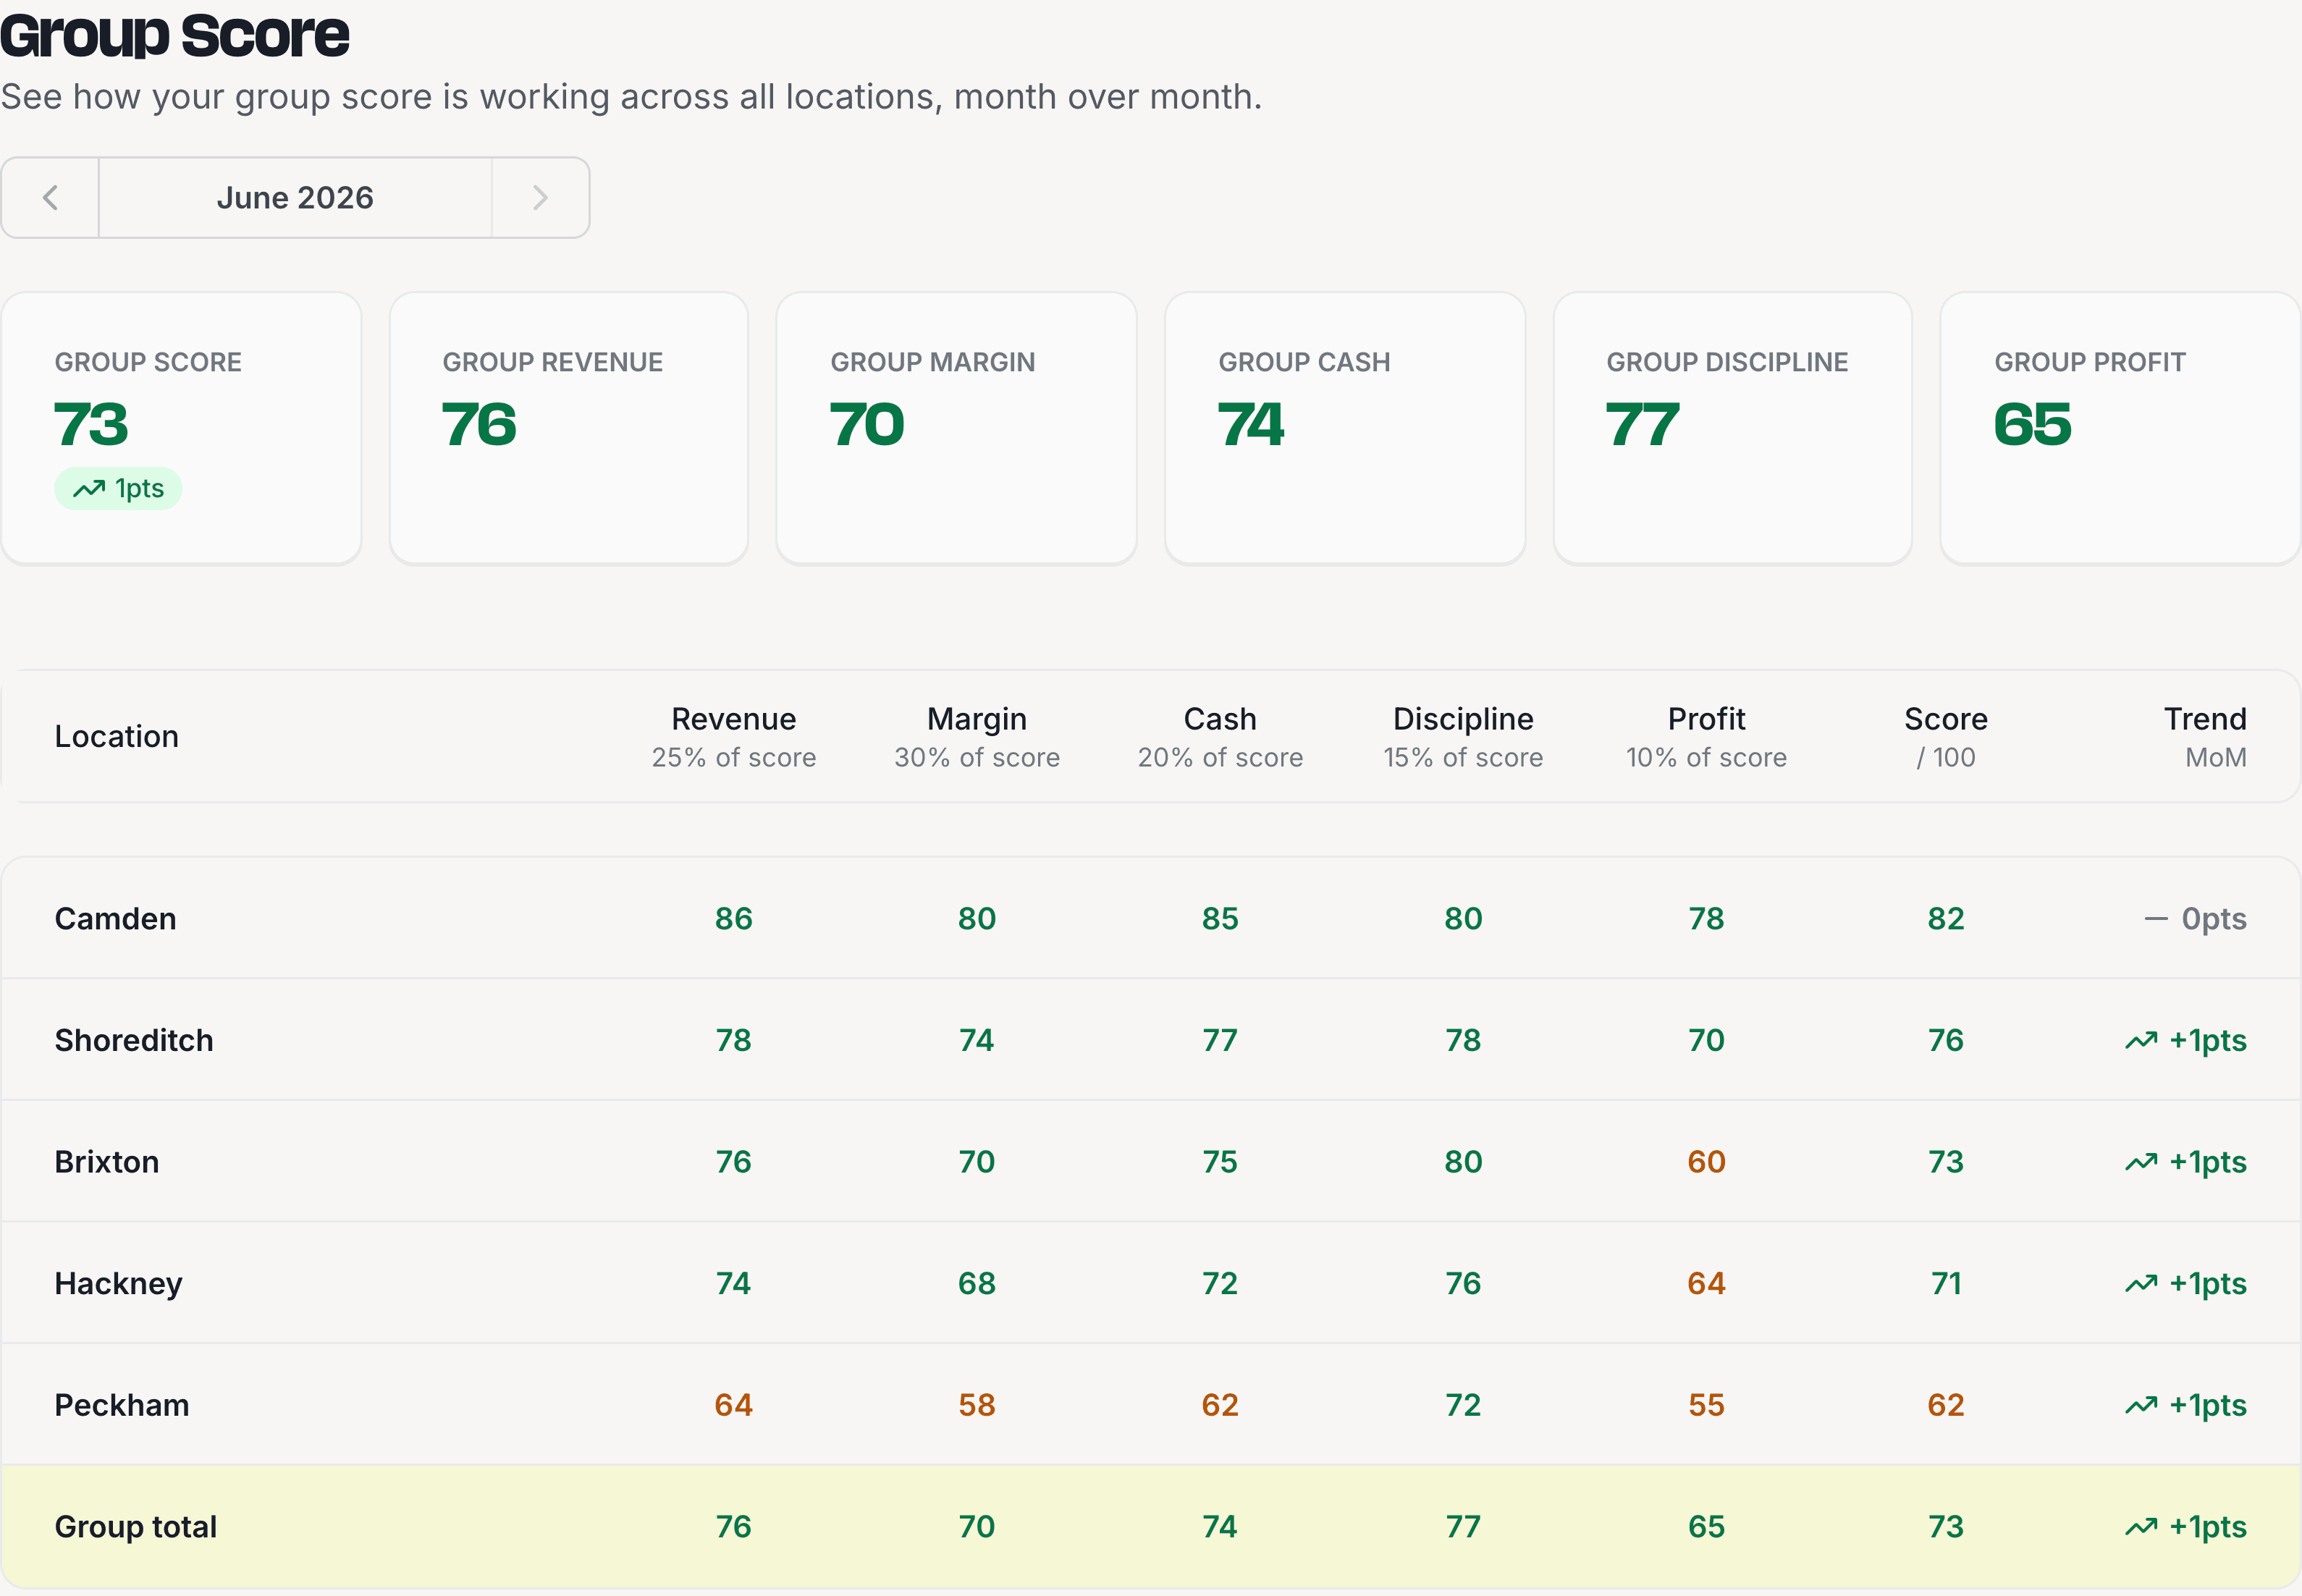
What you can't get from per-location reporting alone.
One score for the whole group.
The average of every location's Alpa Score. Lets you see at a glance whether the group as a whole is improving, holding, or slipping.
Locations sorted by score.
Locations lined up by score, profit margin or trend. The location dragging the average jumps out without you having to ask.
Every location, rolled up.
Consolidated weekly P&L across every location. Each line traceable back to the location that contributed it.
One Monday email.
Summarises every location, leads with whichever is moving most. The outlier sits at the top; the rest follow ranked.
Total spend per vendor.
Across the whole group. Useful for renegotiation, consolidation, and spotting which vendor is moving the food cost line.
Right scope, right person.
Owner sees group + cash. Ops manager sees rankings + alerts. Restaurant manager sees one location. Same data, different lenses.
Included in your per-location price.
Everything above is part of the £29 per-location subscription. No add-on, no extra fee. 30 days free.
See full pricing →Connect every location in 10 minutes. Your group's numbers by tonight.
Connect each location's bank and till in under 10 minutes. Your live numbers land the same day, your full Monday group briefing the following week. 30 days free. No credit card required.